SimulAVR
SimulAVR is a simulator for many AVR devices, including those commonly used in RepRap controllers, like the ATmega328, ATmega644(P) and ATmega1284(P).
Why talk about it here in the RepRap wiki? Well, it's an excellent tool for debugging and enhancing ATmega based controller firmwares like Teacup, Marlin or all other code which can be built from the command line. Doing so, you can:
- attach a debugger (avr-gdb) to the running firmware,
- communicate to the firmware through the serial line, i.e. attach Pronterface,
- connect to other simulated devices, like a LCD display,
- collect accurate pin change timings into a file.
The latter means, you can open this file with something like GtkWave and see accurately, which stepper does a step exactly when. SimulAVR is cycle-accurate, which means, a signal changing procedure taking 100 clock cycles on real hardware will also count exactly 100 clock ticks in the simulator and record signal changes at exactly 1/100 of the CPU frequency. Just great for verifying things like acceleration, smooth stepper movement or look-ahead.
Another important reason is, you can pause the simulator at any time for data processing or variable investigation, simply because an simulated ATmega has a clock independent from the real world clock. 835 ATmega clock ticks are 835 ATmega clock ticks (41.75 μs), even when your wall clock advanced 20 minutes in between.
Contents
Prereqisites
The weaknesses of SimulAVR are its high number of dependencies on other software packages, a pretty complex mechanism for everything but attaching a debugger and an almost total lack of documentation.
To make things more simple, let's try to explain things here. For myself it took me almost a week until I got just the examples coming with SimulAVR running. The operating system of choice here is Debian/Ubuntu Linux. Stuff should apply similarly elsewhere, feel free to add such documentation.
Installation
There are several parts to do.
Compiler environment, software download
This should give you Git and basic compilers:
sudo apt-get install build-essential git gcc-avr avr-libc
The next step is to fetch the most recent SimulAVR sources. Recent sources are important, as releases happen rarely, and the packages coming with Debian/Ubuntu are even older.
git clone git://git.savannah.nongnu.org/simulavr.git# They refuse to accept SIMINFO extension. git clone https://github.com/Traumflug/simulavr.git cd simulavr git checkout traumflug
Standard build
Install the packages required for a standard build as following:
sudo apt-get install build-essential g++ libtool-bin binutils-dev texinfo
This done, configuration should go without flaws:
./bootstrap
./configure --disable-doxygen-doc --enable-dependency-tracking
make
After this you should have a working binary in src/, no need for installation.
On some platforms the build process doesn't always complete successfully, aborting somewhere when building regression tests or documentation. For the purpose of simulation runs, you can ignore these errors if src/simulavr exists.
Running a standard example
To warm up with SimulAVR, let's try one of the two standard examples coming with the Git repository, simple_serial.
Note: for more advanced examples, see the sections about running TCL and Python examples below. Not needed for typical RepRap purposes, though.
First, build it:
$ cd examples/simple_serial/
$ make
[...]
Now run it, type a few characters when requested, hit the enter key. To stop the simulation, hit ctrl-c:
$ ../../src/simulavr -f simple_serial.elf
Hello, world!

Now, please type:
Hi!
received: <H>
received: <i>
received: <!>
received: <
>
^CSystemClock::Endless stopped
number of cpu cycles simulated: 52344198
$
That's it! You see how the firmware recognizes your characters and sends messages back? It's really this simple to run a simulation. Source isn't particularly difficult either, main.c has just 20 lines of code (and a lot of comments).
The very same firmware runs in an ATmega644 equipped, 20 MHz clocked RepRap controller or on an Arduino, too, you can test it with the .hex file already there. For other controllers, you have to adjust build parameters (-mmcu and -DF_CPU) at the bottom of the Makefile.
Preparing your firmware
For better integration into simulation, you can add an informational section to your firmware. This relieves you from remembering command line options and lets you set up a serial connection between firmware and the console/terminal or even Pronterface by just adding a few macros. These don't influence operations of your firmware at all, timings will still be accurate. Also, the binary is still the same, so you can run the very same binary in the simulator as well as on your hardware.
Note: Teacup Firmware is already prepared as part of its standard distribution (as of December 2013), so you can skip this section after setting BAUD to 38400 in config.h.
Adding SIMINFO macros
Somewhere at the root of your firmware, typically before main(), add this:
// Assume firmware and simulavr source code folders are side by side in the same directory.
#include "../simulavr/src/simulavr_info.h"
SIMINFO_DEVICE("atmega644");
SIMINFO_CPUFREQUENCY(F_CPU);
SIMINFO_SERIAL_IN("D0", "-", BAUD);
SIMINFO_SERIAL_OUT("D1", "-", BAUD);
Here is:
"atmega644": your device. Can be "atmega1284", too; the ATmega2560 is currently not supported by SimulAVR.
F_CPU: the clock frequency your hardware is runing at. Typically 16000000UL (16 MHz) or 20000000UL (20 MHz). This doesn't influence simulation speed, but gives timing protocols the right scaling. In most firmware source codes, "F_CPU" is defined to be the right thing, so you can use it straight as written above.
BAUD: the baud rate of the serial port. This must match the baud rate your firmware is actually configured for. Caveat: currently, SimulAVR doesn't support "double speed" UART configurations, which means for Teacup, only 38400 or lower baud rates are supported. Higher rates may produce garbage characters on the terminal, so check BAUD in config.h.
D0, D1: the pins (pin 0 and pin 1 on Port D) your chip has its UART connected to. D0 and D1 are the right ones for UART0 (the standard one) on ATmega644(P) and ATmega1284(P).
For more details on these macros and additional ones, see comments in simulavr_info.h.
Adjusting the Makefile / build parameters
To bring the the SIMINFO section into effect, you have to link with this additional command line parameter:
-Wl,--section-start=.siminfo=0x900000
Also, you have to avoid the -Wl,--gc-sections parameter. This can increase binary size, because dead code is no longer removed.
Attaching a debugger
Assuming your build went flawlessly, you run a firmware as following:
src/simulavr -f <your firmware>.elf
Here is:
- your firmware: the ELF binary of your firmware. ELF binaries typically exist before .hex files are extracted from them, so you should have this already.
Easy, isn't it? You won't see much, though, but if you hit ctrl-c, it'll stop and report how many CPU clocks it has executed.
To run the same inside a debugger, the simulator can serve as a debugger-server with the -g flag. What you then do is not to debug the simulator, but to debug the firmware loaded inside it. This is very helpful if you look for backtraces, intermediate variable contents and such stuff.
While it's possible to do this from a single terminal, all three, debugger, simulator and the firmware inside the simulator, compete for the same user command line, then, which often leads to confusion. Doing this in two terminal windows is much easier.
Terminal #1: run simulator & firmware
$ src/simulavr -g -f ../Teacup_Firmware/build/teacup.elf
Waiting on port 1212 for gdb client to connect...
Terminal #2: run avr-gdb
$ avr-gdb -p 1212
[...]
(gdb) file ../Teacup_Firmware/build/teacup.elf
Reading symbols from /.../teacup.elf...done.
(gdb) target remote localhost:1212
Remote debugging using localhost:1212
[...]
(gdb) load
Loading section .text, size 0x4e24 lma 0x0
Loading section .data, size 0x3c lma 0x4e24
Loading section .eeprom, size 0x20 lma 0x810000
Loading section .siminfo, size 0x91 lma 0x900000
[Note: here you can receive a "Load error", which can be ignored.]
(gdb) cont
Continuing.
^C
Program received signal SIGINT, Interrupt.
0x00002aca in queue_empty () at dda_queue.c:55
55	    result = ((mb_tail == mb_head) && (movebuffer[mb_tail].live == 0))?255:0;
(gdb) backtrace
#0  0x00002aca in queue_empty () at dda_queue.c:55
#1  0x00002caa in queue_wait () at dda_queue.c:196
#2  0x000034c2 in process_gcode_command () at gcode_process.c:156
#3  0x000031f8 in gcode_parse_char (c=10 '\n') at gcode_parse.c:347
#4  0x00004186 in main () at mendel.c:295
(gdb) [... etc. etc.]
As you can see, it works magnificent. All symbols are there as if you'd debug something directly on your PC. You can set breakpoints, show variables, do single stepping in the debugger terminal. At the same time you can interact with your firmware in the first terminal.
Signal tracing
SimulAVR is quite powerful on tracing signals and dumping them into a VCD file, which can be viewed by applications like GTKWave. As there is, to the best of my knowledge, no documentation on this (what a shame for such powerful code), this section is a bit more extended than neccessary for RepRap purposes.
Note: signal/value tracing (options -o, -c) is not to be confused with program flow tracing (option -t). The latter is similar to what you get when running a firmware in the debugger and command "step" all the time.
Preparation
First you have to get a list of the signals available for your device. These are not only all the port pins, but also stuff like SREG, program counter (PC) and other stuff. Getting the list is simple, run:
src/simulavr -d <your device> -o tracelist.txt
Keep this list, it can be viewed with an text editor. Syntax is intuitive, e.g. + PORTA.A0-Out means pin 0 on port A.
Tracing variants
Reference: SetDumpTraceArgs() in src/cmd/dumpargs.cpp.
Variant warnread: Running a simulation with parameters -c warnread will warn you each time an SRAM memory location is read before initialisation. That's undoubly a good measure for making your code more reliable.
Variant vcd: this is the meat and this is what we're talking here about. Variant vcd requires 2 additional parameters and can take a third one, all separated by colons (:):
src/simulavr -c vcd:<infile>:<outfile>.vcd:{r|w|rw} -f <firmware>.elf
Here is:
- infile: a file with a list of all signals to trace. On how to prepare this file, see next section.
- outfile: the file the trace will be written into. This is what we later open with GTKWave.
- {r|w|rw}: this is optional, you can put either the character w or the character r here, or both (rw). This will cause SimulAVR to not only trace the signal itself, but also its write or read accesses. For example, you can detect multiple/unneccessary writes this way.
Writing the infile
Reference: DumpManager::load() in src/traceval.cpp.
It's a simple text file with three different kind of lines:
- Lines starting with #: this is a comment line.
- Lines starting with +: this is a request to trace a signal or a value. Usually you simply copy these from the list of available signals as-is.
- Lines starting with |: this describes a signal range. The syntax is:
| <trace> <min> .. <max>
Note the spaces. Here is:
- trace: the signal register to trace, as given in the list of available signals.
- min: the first pin to trace.
- max: the last pin to trace.
Example:
| PORTB 0 .. 5
to trace pin 0 to 5 on port B.
Putting things together: an example
With the above knowledge, it's quite doable to get decent pin traces without too much effort.
Step 1: look up your electronics to find out to which pins the signals of interest are connected to. Having a pin layout might help. In case of tracing X and Y steppers with a firmware configured for Generation 7 Electronics, this leads to a file, named tracein.txt, similar to this:
# X Dir
+ PORTA.A3-Out
# X Step
+ PORTA.A2-Out
# Y Dir
+ PORTA.A5-Out
# Y Step
+ PORTA.A4-Out
Step 2: Save the infile and run it with your firmware:
$ src/simulavr -c vcd:tracein.txt:trace.vcd -f ../Teacup_Firmware/build/teacup.elf
Enabling tracer: 'vcd'.
Reading values to trace from 'tracein.txt'.
Output VCD file is 'trace.vcd'.
start
ok
G1 X20 Y10 F400
ok
^CSystemClock::Endless stopped
number of cpu cycles simulated: 34139681
$
Somewhat important here is to send a command pretty immediately. If you wait a minute, your trace file will be that long, too. As soon as you think the command is fully executed (there's no real feedback), hit ctrl-c to stop the simulation.
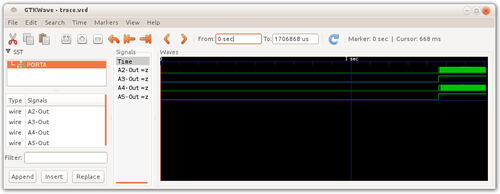
Step 3: view the result in GTKWave:
gtkwave trace.vcd
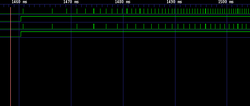
After clicking the word PORTA, dragging all four signal to the list of signals and hitting the minus button in the toolbar often enough, you should see something like this (click on the picture to view it bigger):
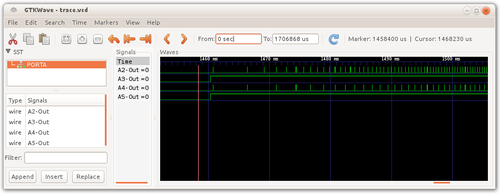
If you click into the area of interest, zooming back into the signals (+ button) will center around this area and eventually you'll see every single stepper pin:
Zooming further in will show you the apparent spikes to be not really spikes, but rectangles, and the rectangle for X is different from the Y one, which reflects what happens in the code, see ... ... well, you'll find out, why :-) Happy exploring!
Doing precision time measurements
The idea to measure cycle-accurate time delays is simple: turn on an I/O output pin where the code sequence in question starts and turn it off where ends. Works even with more than one pin simultanuously and in different places. Turning a pin on and off takes just one clock cycle each, one of which isn't counted. And it doesn't matter wether this pin is used on your real hardware or not.
Running this in SimulAVR, you have two flanges precise to the clock cycle which exactly reflect the time taken to run this code sequence. Ideally, you run this code in a loop to get a number of samples, if it doesn't run in a loop anyways.
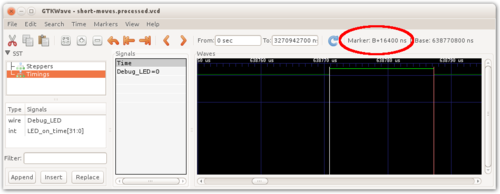
Time between two flanges can then be measured in GTKWave:
- Load the .vcd file and view the signal of interest.
- Click on the raising flange to set the primary marker (red vertical line) there. The marker will usually snap to the nearest flange.
- Select Menu -> Markers -> Copy Primary->B Marker.
- Click in falling flange.
Now you see two markers and near the top right corner of the window you see something like "Marker: B+16400 ns", which means raising and falling flange are 16'400 ns apart, or (16400/1000*20=) 328 clock cycles at 20 MHz.
Running SimulAVRs' scripting examples
This isn't RepRap related and a task surprisingly tricky, but at least some of the examples work and one can learn from how they're set up. The point of scripting is to build custom simulators with simulated devices (like a LCD display) attaches.
TCL examples
Here you need more dependencies and a re-build with a slightly different configuration:
sudo apt-get install tcl-dev itcl3
make distclean
./bootstrap
./configure --enable-tcl
make
Having done this, you can go into each of the examples' directories and type:
make do
Running the stuff from the command line directly is pretty tricky. simavr needs all sorts of command line parameters to work well with its own simulated hardware. For good hints, examine Makefile.am in each of the directories, which contains the example-specific commands.
Python examples
Same as with #TCL Examples, but this time with the following packages/configuration:
sudo apt-get install python-dev swig
make distclean
./bootstrap
./configure --enable-python
make
Again, run
make do
in each of the example directories.


